No. 26 A NEW LOOK AT PRESSURE DROP OCT. 1982 (Revised JULY 1997)
If we can all agree that eating, drinking and women are essential to life, I would propose that pressure drop is the one great essential in filtering jet fuel. Pressure drop was the title of the first GamGram but the message we had at that time was simply the measurement of it. The problem we see now is that few people are able to interpret a reading from a differential pressure gauge.
Suppose that you walked up to a filter separator and took a reading of 8 psi differential pressure. If you really believe that you have learned anything, you need pity! In the first place, you can understand a reading only in comparison with previous readings which should be kept in a log book. In the second place, you must know the flow rate. It would make no sense to compare a pressure drop reading at 150 gpm with one that was obtained at 300 gpm.
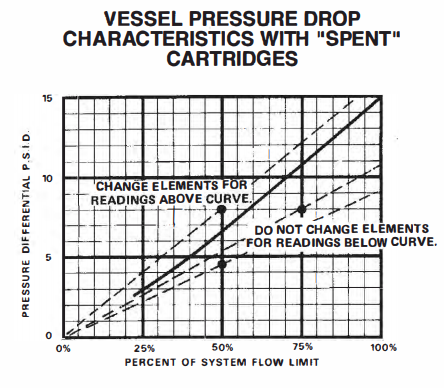
The filter separator manufacturers publish conversion charts so that you can make use of a reading that is taken at a flow rate less than rated flow. Using the following Velcon chart, suppose that 300 gpm is "rated flow". Consider this to be the 100% condition. If you read 8 psi differential at 150 gpm, you would go to this chart where 50% (one half of100%) connects with 8 psi. That point is above the curve so you know that if you operated the filter separator at 300 gpm, you would exceed the recommended limit. In fact, in this example you would have a pressure drop of 16 psi (found by drawing a line through 0 and out to the 100% line).

NOTE:
This curve or similar curves that are published by various filter manufacturers have no relationship to coalescing ability. Pressure differential is only one of the factors that govern when coalescers should be changed. If there is evidence that the water coalescing ability of the elements has been degraded by surfactant contamination, the elements should be changed regardless of differential pressure.
As another example, suppose you had read only 4.5 psi. Find the intersection of 4.5 psi and 50% and draw a line out to 1 00%. You know you would be safe at 100% of rated flow because you are below the solid line. The pressure drop will be about 9 psi at 100% of rated flow. (NOTE: We added the dotted lines to the Velcon curve for these examples.)
Frequently, filter separators are installed that have more flow rate capacity than is needed. Suppose that the maximum flow capability of the pump in the above example was 200gpm. This is the 100% condition, not the 300 gpm rating of the filter. Therefore, 150 gpm is 75% of 200 gpm.
150 gpm/ 200 gpm x 100% = 75%
The intersection of 8 psi at 75% is now below the curve. The 100% condition would result in only about 11 psi.
Differential pressure data are of little value to anyone if the numbers are not recorded somewhere in a form that is understandable to everyone who is involved in the operation of the filter equipment. Too many managers think that all they have to do is to sit with their feet on their desks, waiting until someone reports that the differential pressure has reached 15 psi. Then they will do something about it! The fallacy in this kind of thinking is that the elements may have burst when the differential pressure suddenly went far beyond 15 psi when no one was watching the gauges. The differential pressure would then drop down to a low level and the person who has the responsibility of reading the gauge would report that the differential pressure was well within the acceptable range - under 15 si. THERE IS
SIMPLY NO SUBSTITUTE FOR PLOTTING DIFFERENTIAL PRESSURE DATA ON A CHART.
If you operate a system that has a flow meter, you are really very fortunate. A refueler truck has a meter that you can "time" with a wrist watch and easily calculate the rate of flow. The most expensive and best equipped aircraft refuelers may even have rate of flow indicators. The real problem occurs at the airport fuel farm where there usually are no meters of any kind. How does the operator of a fuel farm determine flow rate? The answer is that he simply cannot do it. This is where the Filter Life Sensor becomes useful. Developed originally by our distributor in the UK, this instrument is a variation of the reliable Gammon Gauge that you use to measure the differential pressure across a filter separator. Refer to our bulletin 91. When you have this instrument, you read your Gammon Gauge to get the
differential pressure and you also read the Filter Life Sensor which we formerly called the percentage flowmeter. For example, suppose that the differential gauge indicates 7 psi and the Filter Life Sensor indicates 60%. Referring to the chart on the front page, find where 7psi and 60% cross - you can see that you are below the line but you will soon have to change elements.
IN SUMMARY:
Never try to understand one reading of differential pressure. You must know the flow rate when the reading was made. You must have records so that you can compare a reading with previously recorded data.